

Read your workspace analytics
Use the Analytics page to see what your team made, who it reached and what it cost: the Overview, Content, Reach, Autopilot and Credits tabs, periods, Everyone or Mine, Find (⌘K), drawers, tables and CSV export.
Analytics shows what your team makes, who it reaches and what it costs, for the whole workspace. Each tab leads with a few answers; click any number to see where it comes from. For one video's viewers, see Read video analytics.
Before you start
- Every member of the workspace can open Analytics, on every plan. It's in the sidebar.
- Members see only items they can open. Pieces in collections you're not part of are left out or grouped as "Other collections".
- Some tabs show only when they have something to show: Help center needs a doc site, and Autopilot needs Autopilot turned on for the workspace. See Understand Autopilot.
Find your way around
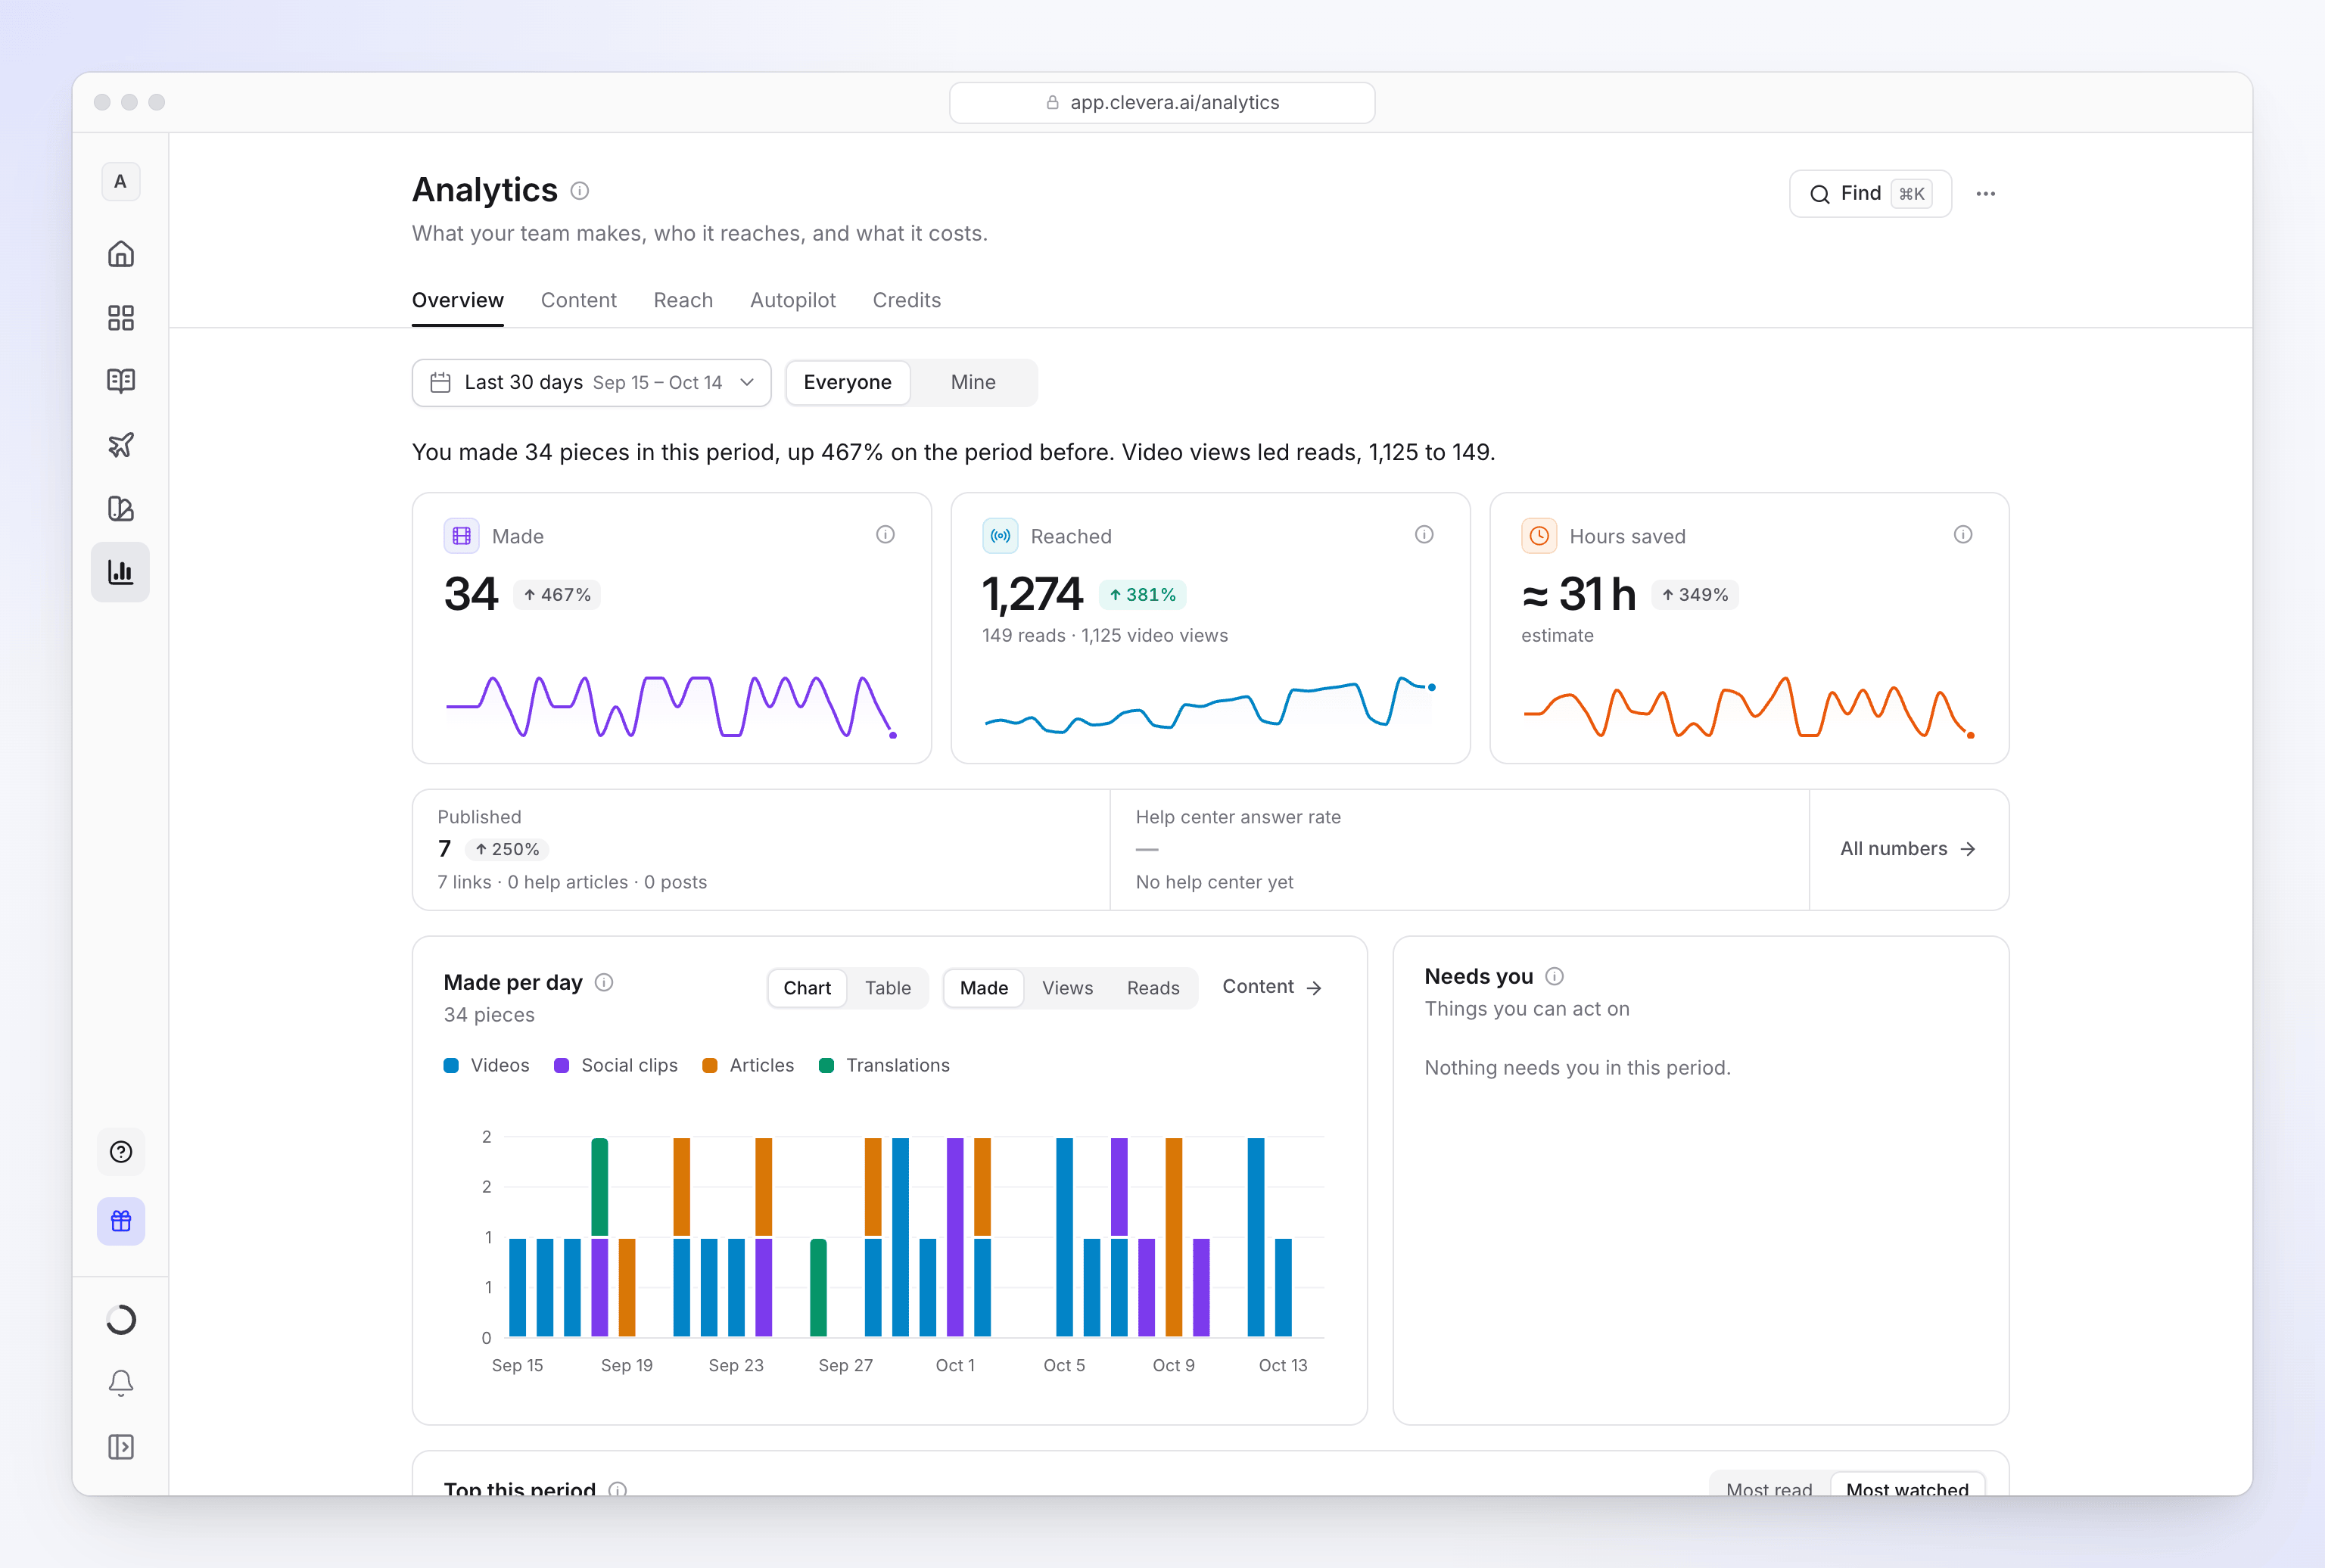
| Part | What it does |
|---|---|
| Tabs | Overview, Content, Reach, Autopilot and Credits |
| Period | Today, Yesterday, Last 7 days, Last 30 days, Last 90 days, This month, Last month, This cycle, Last cycle, This year, Last 12 months or a custom range. This cycle and Last cycle follow your billing cycle and appear when you have one. Changes compare with the period just before. |
| Everyone / Mine | The whole workspace (what you can open), or only what you made. On Overview, Content, Reach and Autopilot. |
| Tab filter | Content: a kind. Reach: a place (Share page, Embeds, Help center, Platforms). Help center: a site, when you have more than one. Autopilot: a task. |
| Find (⌘K or Ctrl K) | Search every number and report on the page. |
| ⋯ | Export CSV of the tab for the period and filters, and Copy link to this view (tab, period and filters included). |
| How we count (ⓘ next to the title) | The counting rules in four lines, and the time zone days follow. |
Read the numbers
Each tab is built in layers, so the page stays short and nothing is more than a click away:
| Layer | What you see | Click it to |
|---|---|---|
| Large tiles | Up to three main numbers, with the change against the previous period and a small trend | Open the number's drawer |
| Strip | Smaller numbers in one row, with All numbers at the end | Open the number's drawer |
| Charts and lists | The top 5 rows (top 3 in side cards) | See all opens a table with every row and column, a filter box and Download CSV |
| Folded rows | Reports few people need, closed, with a one-line preview | Open the report in place |
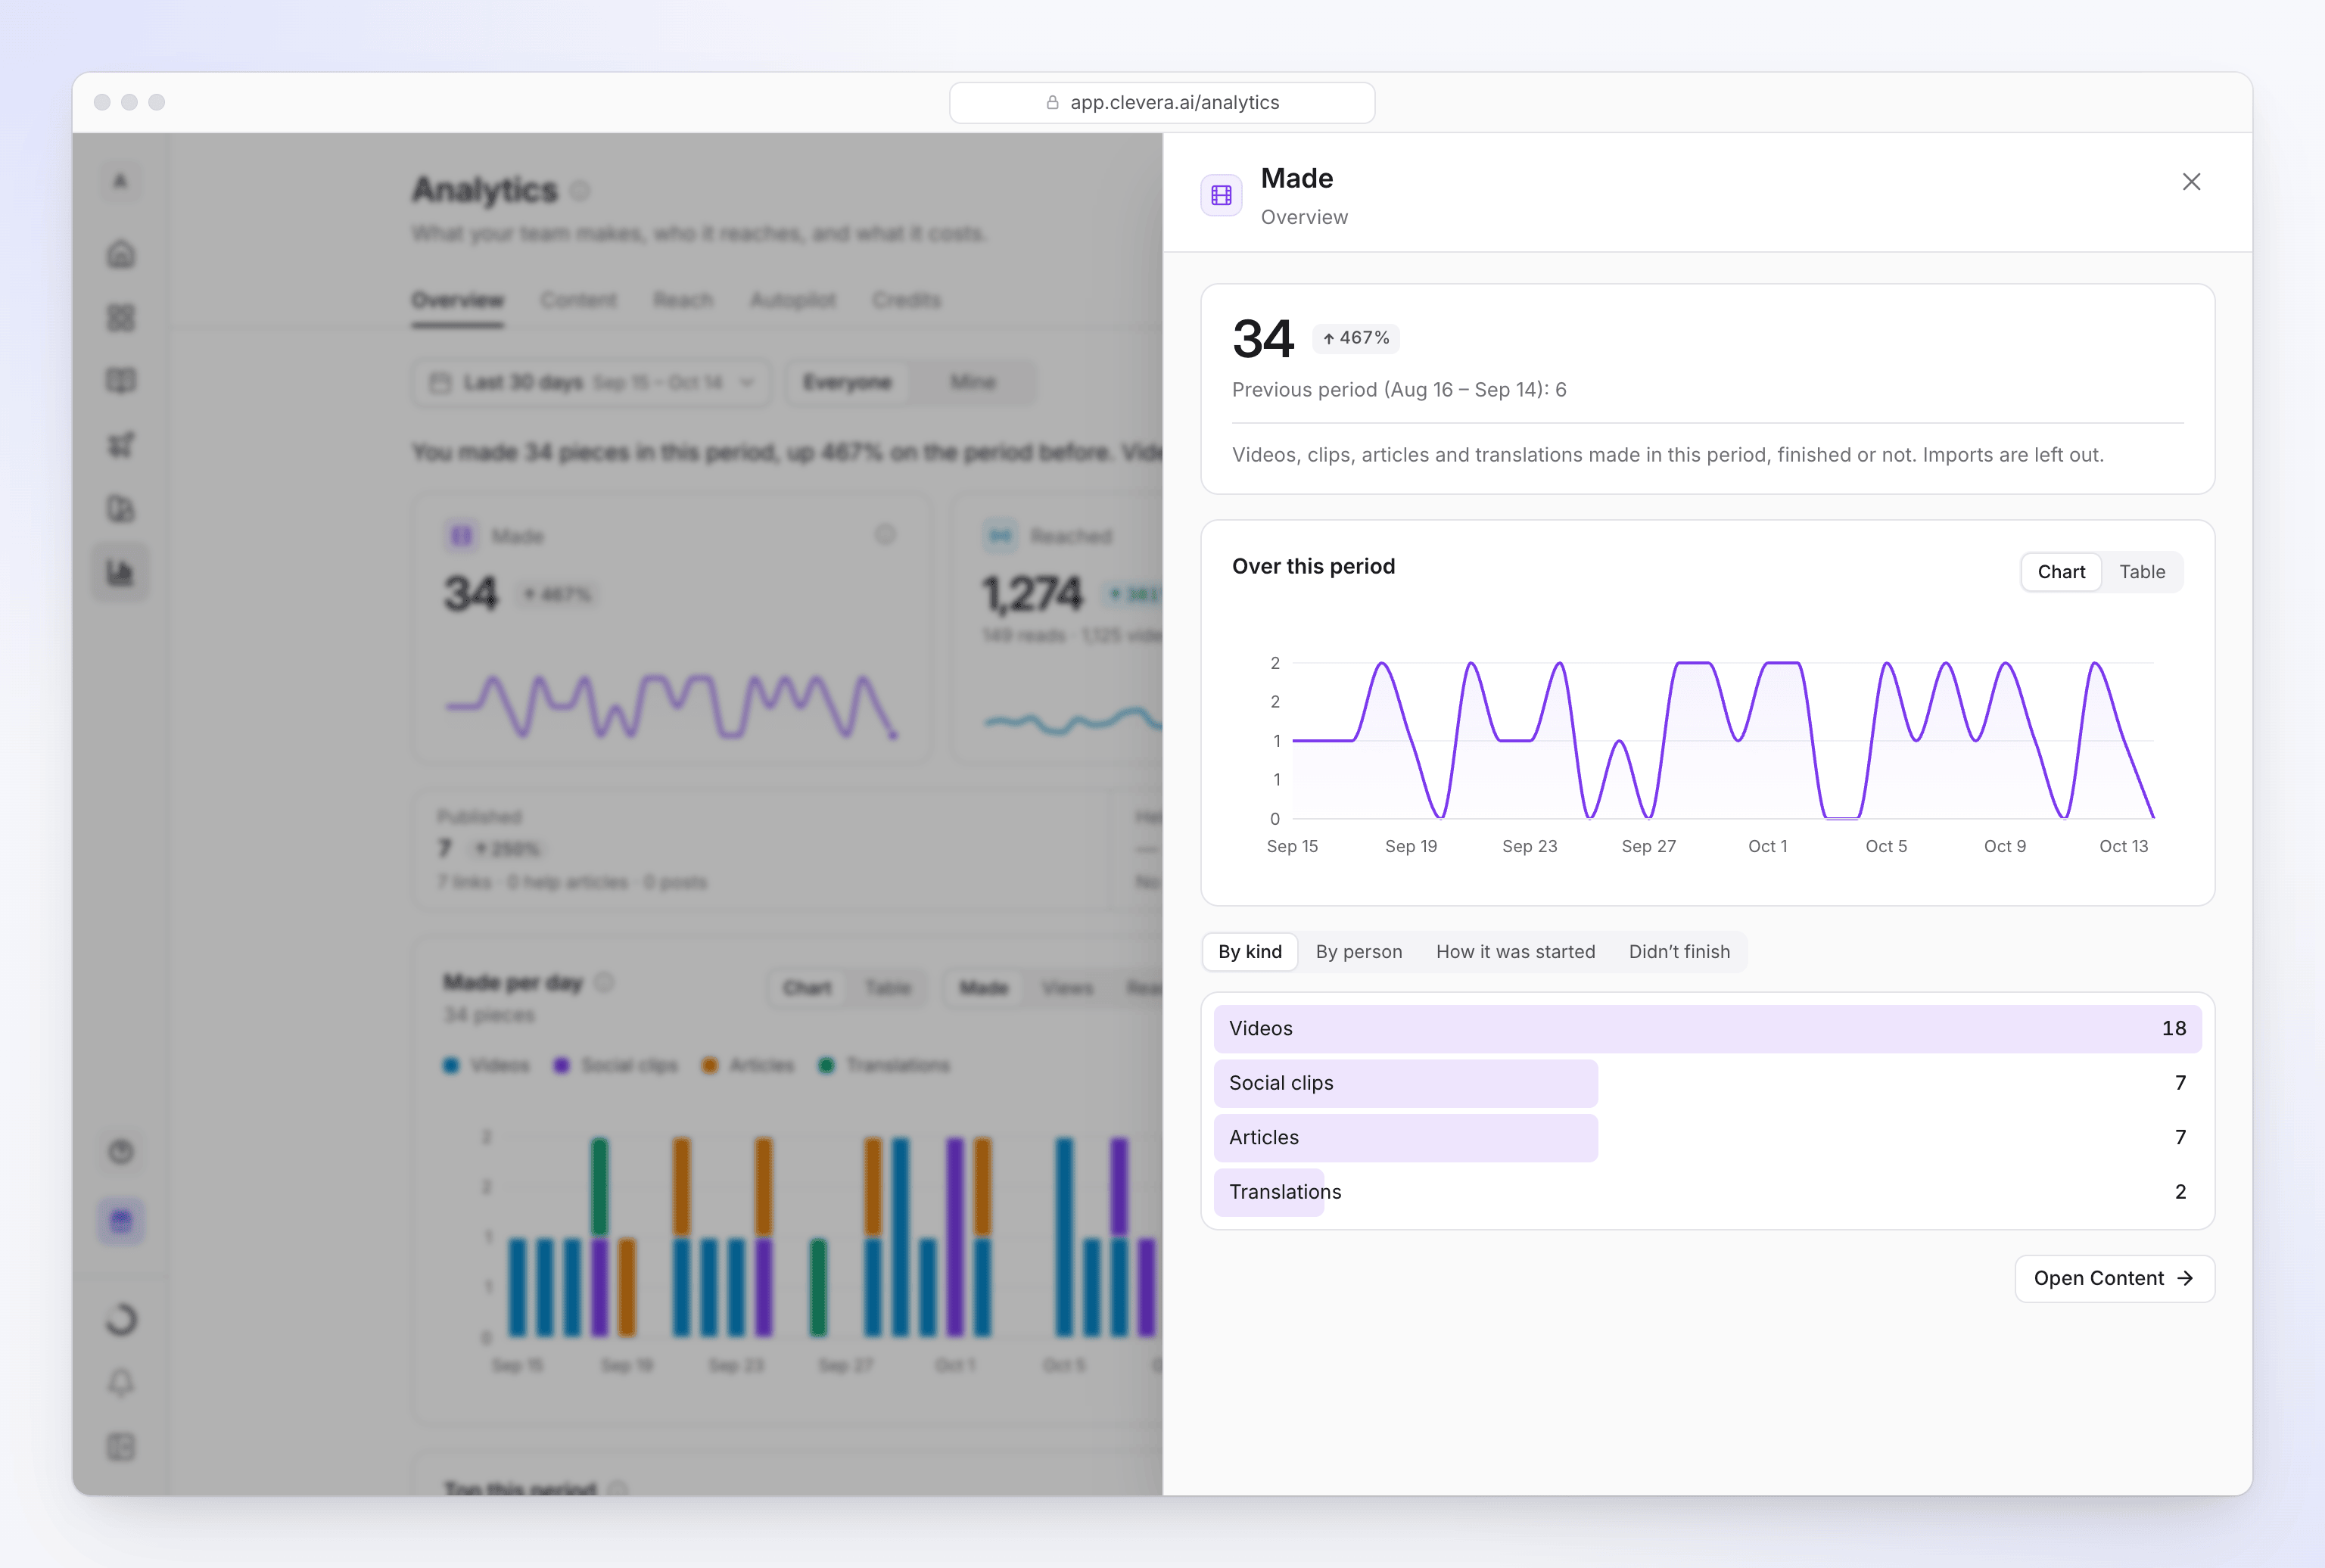
A number's drawer shows its value, the change, the previous period's value, a chart over the period with a Table switch, and breakdowns of what it's made of, such as By kind or By person. When the number belongs to another tab, a button such as Open Content takes you there.
Rows in lists open their own details: a video or article, a person, a collection, a help-center page or a task.
Find a number
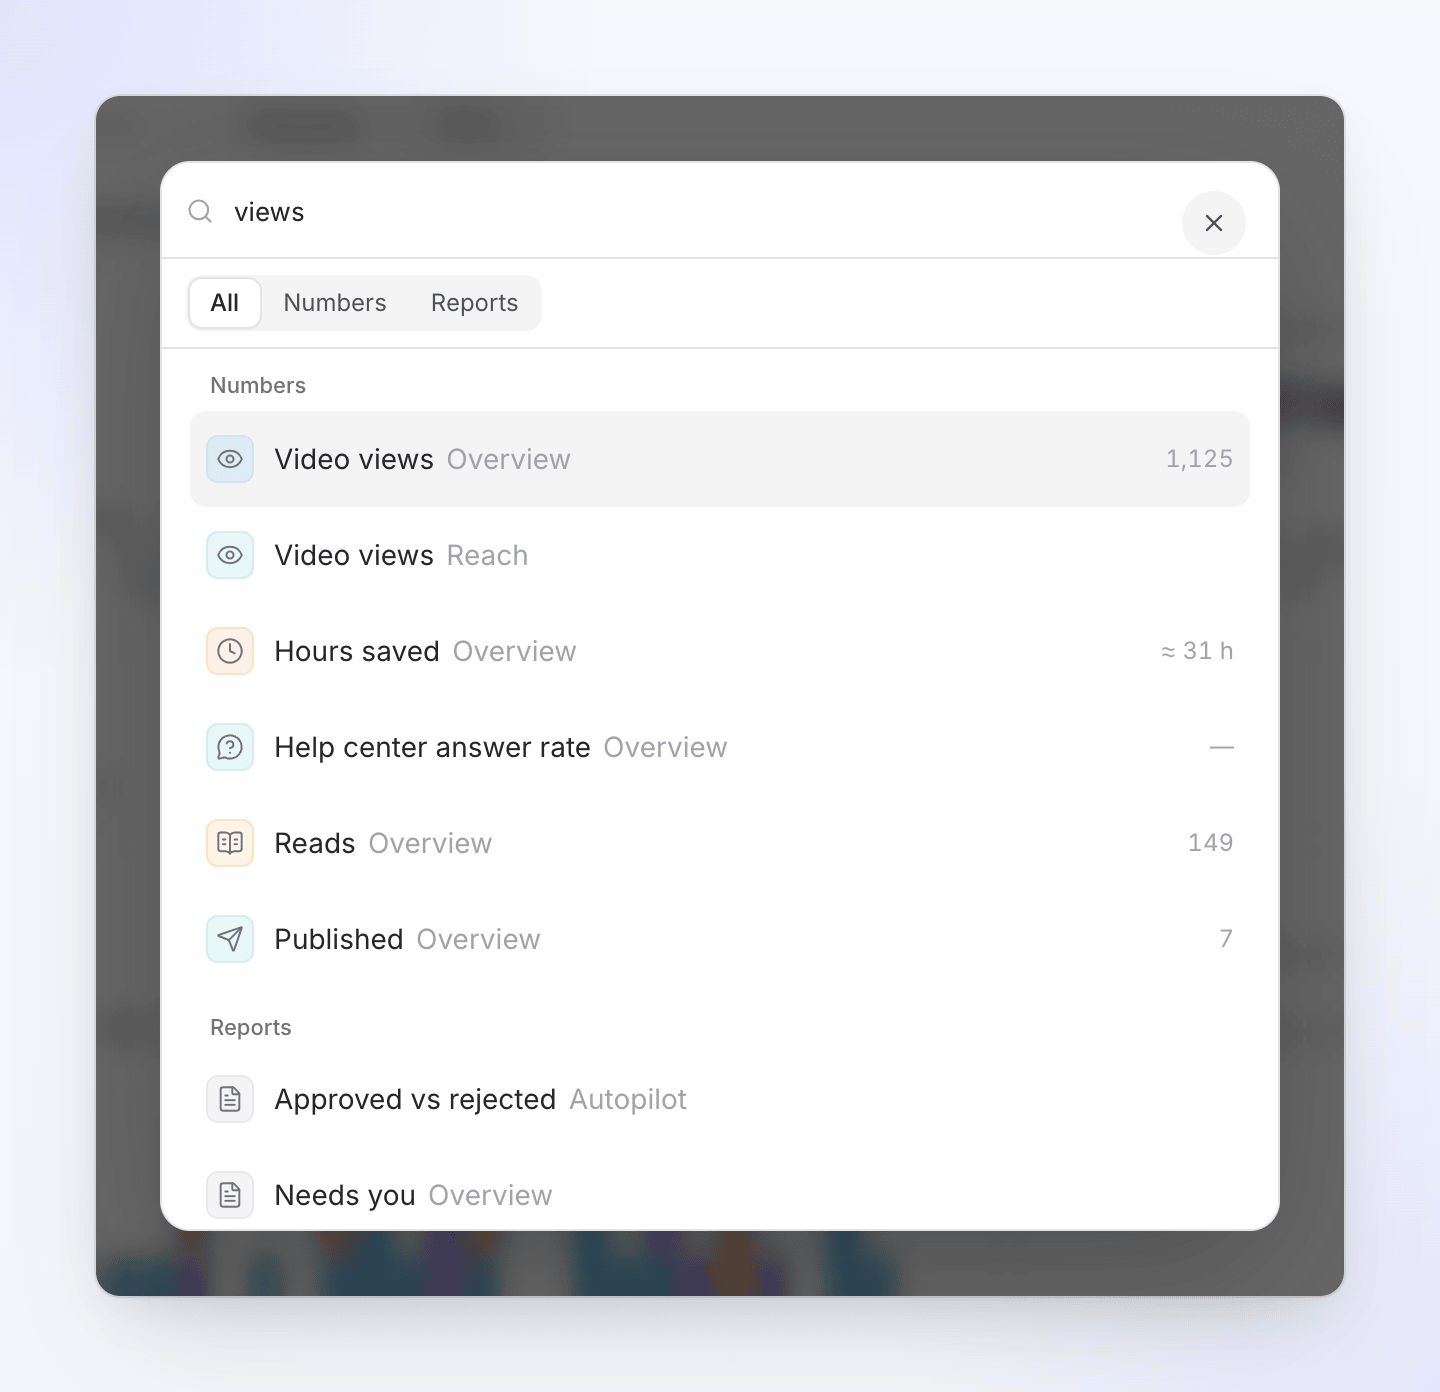
Click Find (or press ⌘K / Ctrl K) and type, for example "views". Pick a number to open its drawer, or a report to jump to it. Switch between All, Numbers and Reports to narrow the list.
The tabs
Overview
A sentence at the top sums up the period, for example "You made 16 pieces in this period, up 167% on the period before."
| Number | What it counts |
|---|---|
| Made | "Videos, clips, articles and translations made in this period, finished or not. Imports are left out." |
| Reached | Video views plus reads. The line under it splits them. |
| Hours saved | An estimate of the hand work the finished pieces replaced (see How Hours saved is estimated). |
| Published | "Things that went live for the first time: share links, help-center pages and platform posts." |
| Help center answer rate | "Share of reader searches and assistant questions that found an answer." Shows "No help center yet" without a doc site. |
Below them: a chart with Made, Views and Reads; Needs you, at most four things you can act on (hide one with Not now, Not useful or Already done); and Top this period, with Most read and Most watched.
Content
What was made and how it went.
| Number | What it counts |
|---|---|
| Made | Pieces made in the period, finished or not, counted once each. Imports are shown but not counted. |
| Succeeded | Runs that finished, of those that finished or failed |
| Ready in | The typical (median) time from start to a finished piece |
| Video minutes | Minutes of finished videos and clips |
| Exports | Finished exports, on your device and on our servers |
| Rated good | Thumbs-up share of ratings on pieces made in the period, from 5 ratings |
Then Made per day with How it was started (Compose, Autopilot, Assistant, Import), By kind with a Full table, By person or By task, and Didn't finish: failed runs by reason, with the most common reason.
Reach
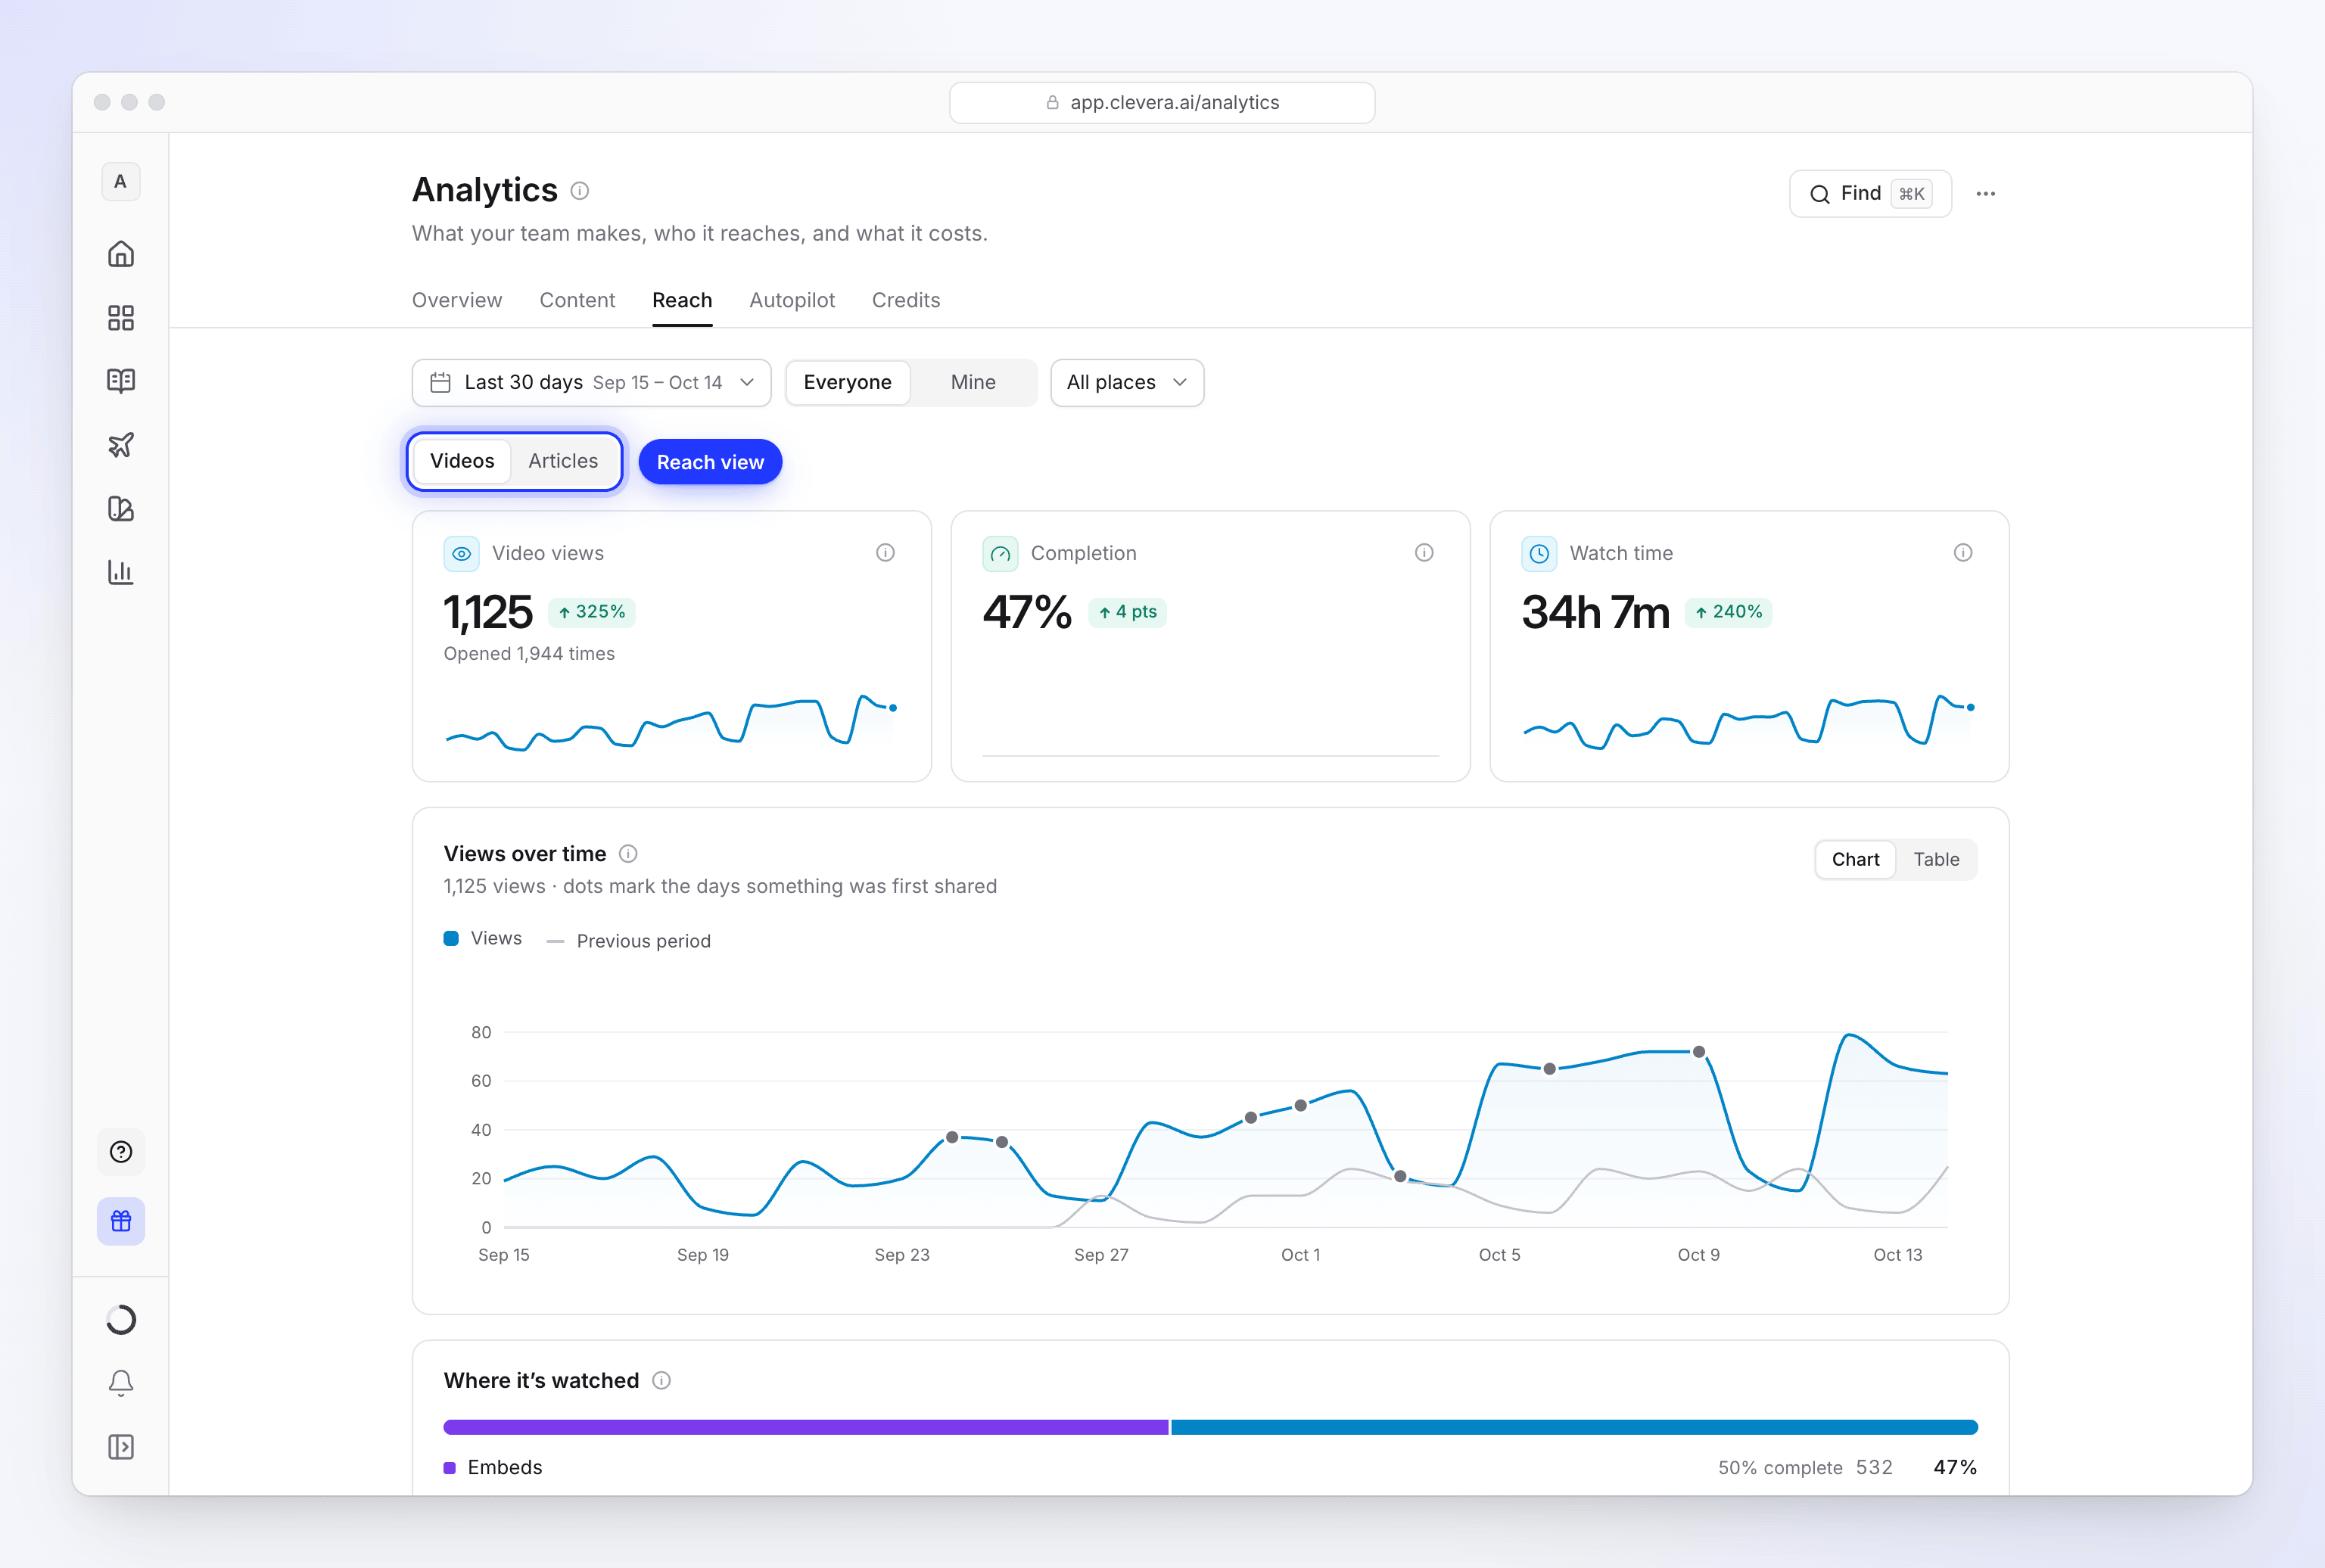
Reach has a switch for Videos, Articles and, with a doc site, Help center.
| View | Numbers | Below them |
|---|---|---|
| Videos | Video views, Completion (views that watched to the end), Watch time | Views over time (dots mark days something was first shared), Where it's watched (share page, embeds, help center), Most watched, and the folded More about viewers (countries, and views by weekday and hour from 20 views) and Published to platforms |
| Articles | Reads (help-center page views plus article opens on share pages and embeds), Read to the end | Reads over time, Most read |
| Help center | Page views, Answer rate, Helpful, Searches, Contact messages | Readers over time, No answer found (searches and questions with no answer, with a way to write the missing article), Top pages, and the folded Where readers come from and Sites |
How a video view is counted is explained in Read video analytics. Each doc site also has its own insights; see Read doc site insights.
Autopilot
Shown when your workspace uses Autopilot.
| Number | What it counts |
|---|---|
| Tasks run | Tasks that started running in the period |
| Items delivered | Plan lines that finished in the period. Ones undone later are left out. |
| Credits spent | Credits your tasks' items used |
| Approved | Lines and outputs you approved, out of every review decision |
| Hours saved | The estimate for what tasks made |
| Repeats active | Repeat and Keep up to date schedules running now, whatever the period |
Below them: Delivered per day, Tasks (click one for its receipt; see Read an Autopilot task receipt), Repeats and watches, and the folded Approved vs rejected and Didn't finish.
Credits
How many credits were used and where they went. People who can manage billing see the workspace's credits; everyone else sees their own. It shows credits used and left this cycle, what they were paid from, the average per day, Usage over time, Where it went (by item, activity, content type, member or collection) and the Credit history. Click Filter to narrow it to a collection, activity or member. See Check where your credits went.
How Hours saved is estimated
Hours saved is shown with ≈ and labelled "estimate". It counts finished pieces only, never imports, and leaves out pieces deleted within 7 days.
| Piece | Counts as |
|---|---|
| A video | 30 minutes per minute of finished video, at least 30 minutes |
| A social clip | 45 minutes |
| An article | 60 minutes |
| A translated video | 15 minutes per minute, at least 15 minutes |
| A translated article | 20 minutes |
| A social post an Autopilot task delivered | 15 minutes |
Troubleshooting
| What you see | Why |
|---|---|
| A tab is missing | Help center needs a doc site; Autopilot needs Autopilot on for the workspace. |
| A number shows "—" | There isn't enough to show yet, for example Rated good under 5 ratings, or an answer rate without a doc site. |
| Your own test plays don't show | Views leave out bots and your own team. See Read video analytics. |
| "Nothing in this period." | Pick a longer period, or switch from Mine to Everyone. |
| "We couldn't load this." | Click Try again. "This is usually brief. Your numbers are safe." |